Auckland economic update September 2026
Author:
Ross WilsonSource:
Auckland Council Social and Economic Research and Evaluation TeamPublication date:
2026Topics:
EconomyAn overview of the Auckland economy for September 2026, in charts and graphs and with some commentary.
Measures covered are: house prices and numbers sold, weekly rents, building consents, employment and unemployment, GDP, business and consumer confidence, retail sales, imports.
Highlights include:
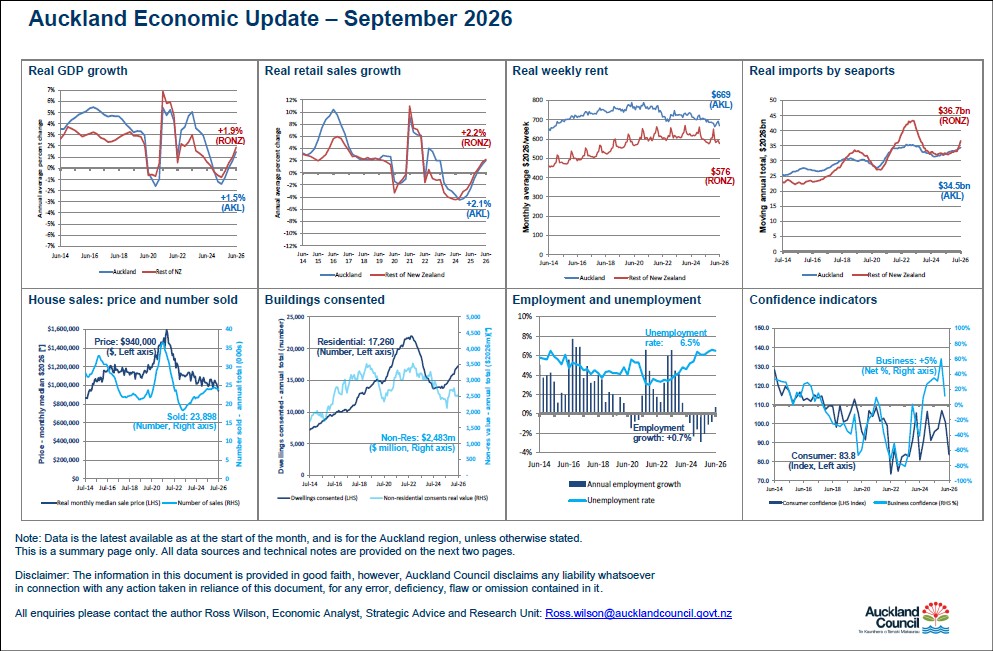
real* Gross Domestic Product (GDP) for the year ended June 2026 was 1.5% higher than for the year ended June 2025; in the rest of New Zealand, the annual change was 1.9% rise. Both growth rates: continued the improvements since the June 2025 lows; were now solidly positive; were below most of 2010 to 2023; were a little above their 2022 (post-Covid) troughs;
real* retail sales for the year ended June 2026 were 2.1% higher than for the year ended June 2025; in the rest of New Zealand, the annual change was a 2.2% rise. Both growth rates continued the improvements of the last six or eight quarters, in contrast to the falls from 2021 to 2024. They are still quite modest despite (small) population increases, so at the low end compared to the pre-Covid levels of at least 2%;
number of people employed in the quarter ended June 2026 was 0.7% higher than June 2025 quarter: the first quarter of positive annual growth in two years; the fourth quarter in a row of improving growth; but lower than most of 2009 (post-GFC) to 2023;
unemployment rate in the June 2026 quarter was 6.5%: fairly flat since June 2025; double the 2021 trough; highest-equal since 2014; similar to most of 2011 to 2015, but 1.6% below the 2010 peak (8.1%);
median house price for the month of July 2026 was $940,000 (in real* dollars: 4% below last month; 7% below a year ago; slight downtrend since November 2023; 41% below the 2021 peak; lowest July price since 2014);
number of houses sold for the year ended July 2026 was 23,898: gradually dipping since March 2026; rising 30% since the May 2023 trough; 34% below the 2021 peak; above mid-2017 to mid-2020;
average weekly rent for the month of June 2026 was $669 (in real* dollars: 3% below May, returning to the downtrend since mid-2024; similar now to twelve years ago). For the rest of New Zealand, the figure was $576: 3% below May 2026 (but highly seasonal); 2% below a year ago; trending down since 2024; the lowest June rent since 2020;
number of new dwellings consented in the year ended July 2026 was 17,260: 1% above June, and rising strongly by 20% in a year; 21% below the September 2022 peak; 14% above 2019’s pre-Covid-boom level;
real* value of new non-residential buildings consented in the year ended July 2026 was $2,483 million: 2% below June; 17% above August 2025’s trough; 6% above a year ago; 30% below 2022 and 2019 peaks; 7% above the 2020 trough before the Covid boom;
real* value of imports by Auckland seaports for the year ended July 2026 was $34.5 billion: slowly rising 10% since October 2024, still 2% below April 2023, but 25% higher than the 2020 Covid trough. For the rest of New Zealand, the figure was $36.7 billion: up 11% in three months (partly due to rising fuel prices?), but 15% below their 2023 post-Covid rebound peak. Auckland has mostly been half the New Zealand total since 2018; previously it was mostly more than half.
*Note: real dollars/values are after adjusting for the effects of inflation each quarter, so a similar ‘real’ level means that a value rose at a similar rate to inflation.
September 2026
Previous updates.
2025