Auckland economic update October 2026
Author:
Ross WilsonSource:
Auckland Council Social and Economic Research and Evaluation TeamPublication date:
2026Topics:
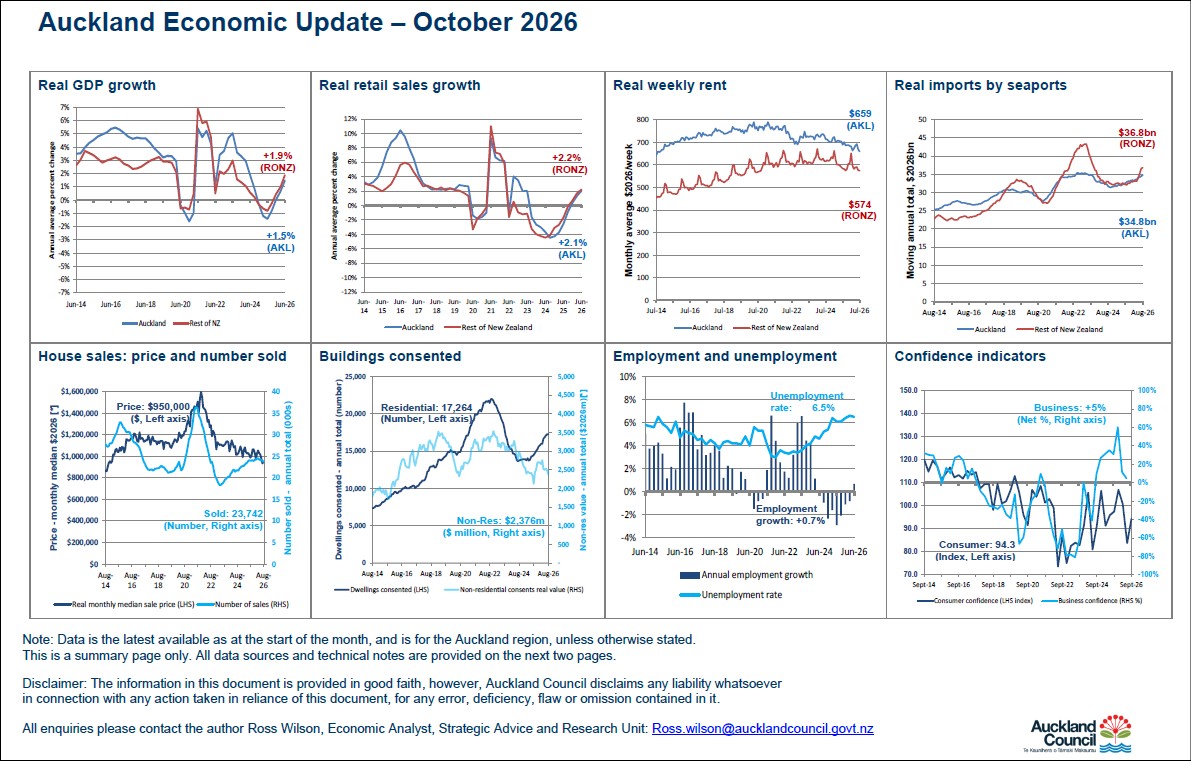
EconomyAn overview of the Auckland economy for October 2026, in charts and graphs and with some commentary.
Measures covered are: house prices and numbers sold, weekly rents, building consents, employment and unemployment, GDP, business and consumer confidence, retail sales, imports.
Highlights include:
consumer confidence (Westpac McDermott Miller Index) for the September 2026 quarter was 94.3 (100 is neutral), a small rise partly reversing last quarter’s fall; fluctuating wildly since 2023;
median house price for the month of August 2026 was $950,000 (in real* dollars: 4% below last month; 4% below a year ago; slight downtrend since November 2023; 41% below 2021 peak; second-lowest price since 2014);
number of houses sold for the year ended August 2026 was 23,742: gradually dipping since March 2026; rising 30% since the May 2023 trough; 35% below the 2021 peak; above mid-2017 to mid-2020;
average weekly rent for the month of July 2026 was $659 (in real* dollars: 1% below June, continuing the downtrend since mid-2024; similar now to twelve years ago). For the rest of New Zealand, the figure was $574: same as June 2026 (but highly seasonal); 1% below a year ago; the lowest-equal level since 2020;
number of new dwellings consented in the year ended August 2026 was 17,264: same as July, but rising strongly by 19% in a year; 21% below the September 2022 peak; 14% above 2019’s pre-Covid-boom level;
real* value of new non-residential buildings consented in the year ended August 2026 was $2,376 million: 4% below July; 12% above August 2025’s trough a year ago; 33% below 2022 and 2019 peaks; 2% above the 2020 trough before the Covid boom;
real* value of imports by Auckland seaports for the year ended August 2026 was $34.8 billion: slowly rising 11% since October 2024, still 2% below April 2023, but 26% higher than the 2020 Covid trough. For the rest of New Zealand, the figure was $36.8 billion: similar to July, but up 11% in four months, but 15% below their 2023 post-Covid rebound peak. Since 2018 Auckland has mostly been half or less of the New Zealand total; previously it was mostly more than half.
*Note: real dollars/values are after adjusting for the effects of inflation each quarter, so a similar ‘real’ level means that a value rose at a similar rate to inflation.
October 2026
Previous updates.
2025