Auckland economic update June 2025
Author:
Ross WilsonSource:
Auckland Council Social and Economic Research and Evaluation TeamPublication date:
2025Topics:
EconomyAn overview of the Auckland economy for June 2025, in charts and graphs and with some commentary.
Measures covered: house prices and numbers sold, weekly rents, building consents, employment and unemployment, GDP, business and consumer confidence, retail sales, imports.
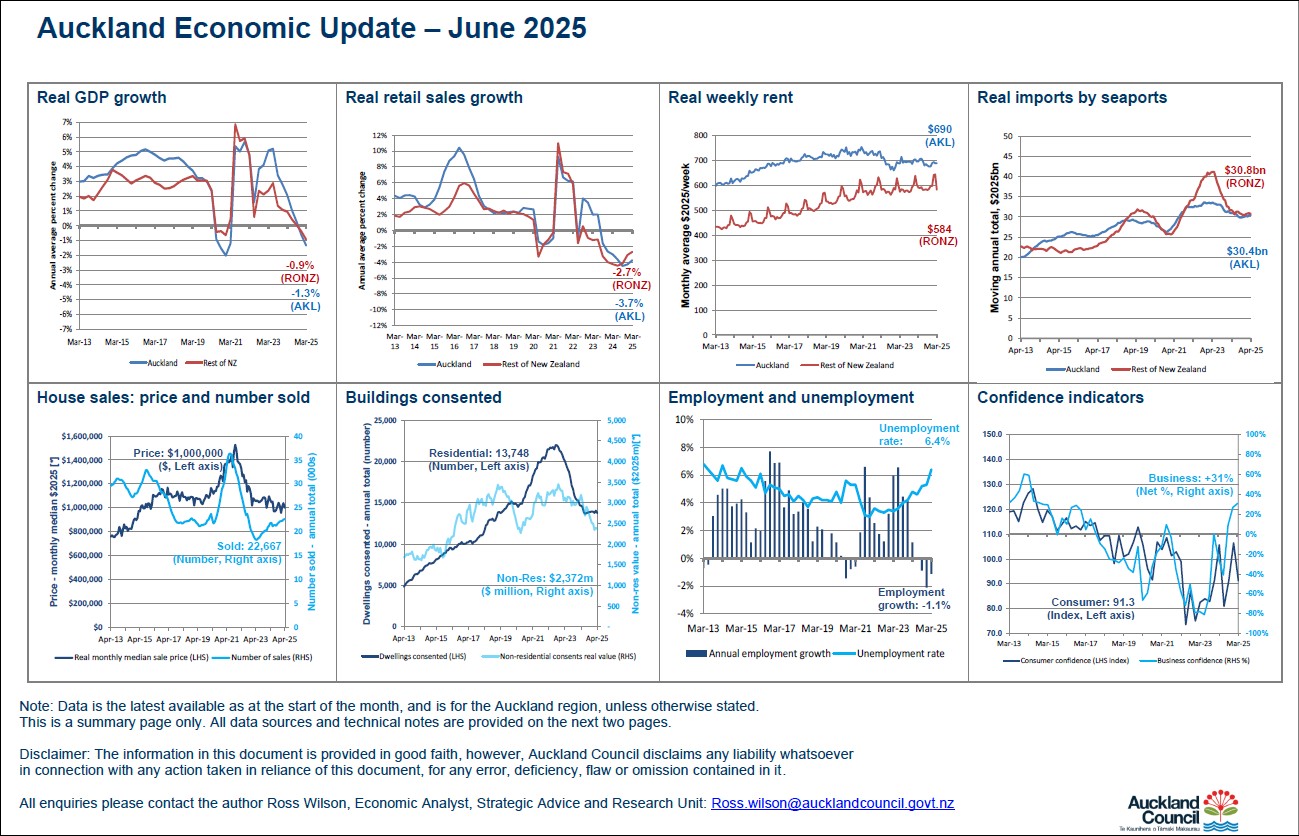
Highlights include:
- real* Gross Domestic Product (GDP) for the year ended March 2025 was 1.3% lower than for the year ended March 2024; in the rest of New Zealand, the annual change was 0.9% fall (see notes). Both growth rates were: falling since mid-2023; similar to their Covid-related troughs of 2020; below all other periods since 2010;
- real* retail sales for the year ended March 2025 were 3.7% lower than for the year ended March 2024; in the rest of New Zealand, the annual change was a 2.7% fall. Both growth rates were among the lowest (most negative) since 2009 (just after the Global Financial Crisis), with Auckland continuing below its 2020 Covid-related trough; but now both growth rates are rising slightly (but still negative);
- unemployment rate for the quarter ended March 2025 was 6.4%: the highest quarter since 2015 and worse than during the 2020-2021 Covid lockdowns, but still lower than most of 2010 to 2013;
- number of people employed for the quarter ended March 2025 was 1.1% lower than in March 2024 quarter: the third quarter in a row of negative annual growth rates despite population growth; similar to during the 2020-2021 Covid lockdowns;
- median house price for the month of April 2025 was $1,000,000 (in real* dollars: similar to the last several months; similar to ten years ago (2015); 6% lower than a year ago; 35% below the 2021 peak);
- number of houses sold for the year ended April 2025 was 22,667: rising continuously for seven months, 24% above the May 2023 trough; similar to 2017-2020; but 38% below the July 2021 peak;
- average weekly rent for the month of March 2025 was $690 (in real* dollars: similar to the last three months, and two years; similar to eight years ago; below 2017 to 2021). For the rest of New Zealand, the figure was $584: a 10% real fall since February (probably due to seasonality), 1% below March 2024; 1% annual average increase in the last five years;
- number of new dwellings consented in the year ended April 2025 was 13,748: 2% below March – similar to the previous 9 months; 37% below the September 2022 peak; 9% below the 2019 pre-Covid peak;
- real* value of new non-residential buildings consented in the year ended April 2025 was $2,372 million: 1% below February, but above January; 26% below a year ago; similar to the 2020 trough and among the lowest since 2016; 31% below the 2022 peak;
- real* value of imports by Auckland seaports for the year ended April 2025 was $30.4 billion, rising gradually since October 2024, still 9% below April 2023, but 16% higher than the 2020 Covid trough. For the rest of New Zealand, the figure was $30.8 billion: similar to the last several months, 20% above late 2020, and 25% lower than their 2023 post-Covid rebound peak;
*Note: real dollars/values are after adjusting for the effects of inflation each quarter, so a similar ‘real’ level means that a value rose at a similar rate to inflation.
June 2025
Previous updates.
2024